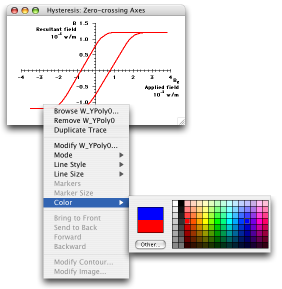
One way would be to right-click (control-click on Mac) and choose from the contextual menu:
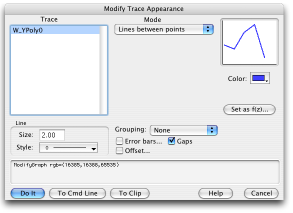
Or, you could double-click on the red trace to bring up a dialog. The following shows the dialog after the color blue has been selected:
The command shown will be executed when the Do It button is clicked. For purposes of illustration, the To Cmd Line button was pressed which simply places the command on the command line without execution as shown here:
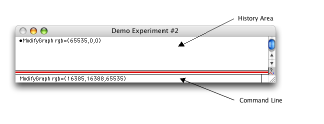
The history area shows a previous comamnd (which set the color to red) while the command about to be executed is on the command line.
The history area provides a record of what you have done and commands can be easily be modified and re-executed.
Dialog Improvements
Now, for operations that can produce a matrix result, such as FFT or Convolve, you can choose to display the result as an image or contour plot.
Graphing Improvements
You can now cause a y axis to be autoscaled to the subset of data defined by the current x axis range.
You can now autoscale just one end of an axis.
You can now mask individual points for display.
New styles are now available for arrowMarker mode and you can now draw arrows between points.
You can now have up to 10 cursors.
You can now scale a trace in addition to offsetting.
Table Improvements
You can now choose the decimal symbol (dot or comma) used when entering data in tables.
The target cell ID area in the top-left corner of the table now identifies wave element corresponding to the target cell.
Save Table Copy to a text file now includes the horizontal row of dimension labels if they are displayed.
Greatly improved display speed with a very large number of columns.
You can now independently adjust the width and properties of columns for a multidimensional wave.
You can autosize the columns of a wave.
You can show and hide various parts of a table.
Notebook Improvements
Special characters (e.g., pictures, date, time) now have names. Advanced programmers can list, get info and find by name.
Added a new kind of special character called an "action". An action is a special character which, when clicked, executes Igor commands.
You can now magnify text.
Gizmo Improvements
ColorScales can now be defined by a color wave with an arbitrary number of entries. ColorScales now also have an optional depth to obtain a 3D appearance.
You can now provide a numerical wave for tickmark positions and a text wave for tickmark labels for each one of the 12 box axes.
There are now built-in box-axes labels.
Added support for Quaternary plots using scatter or path objects.
Isosurfaces can now be saved as triangle waves.
Drawing Improvements
New arrow styles for Draw tools.
New coordinate transformations including translate, rotate, scale and origin.
New named groups for Draw tools using SetDrawEnv with keywords gname and gedit.
New operation DrawAction provides support for deleting, inserting and reading back a named group or entire draw layer. Useful for region of interest (ROI) readback for image processing.
New snap grid for draw and control layout.
Can now rotate draw objects.
When dragging, resizing or rotating, a live outline of the object(s) is presented.
You can now resize multiple selected objects.
Annotation Improvements
ColorScales can frame up to 98 individual colors, the frame color can be different than the annotation's foreground color, the axis range can be manually set, and date axis tick labels are supported.
You can now adjust line spacing.
Control Improvements
New snap grid for draw and control layout.
ListBoxes now support graph and picture images.
ListBoxes and other controls now support mousewheel.
SetVariable now supports a matrix wave.
Control Panel Improvements
New noEdit keyword and no-activate mode for panels
You can now create panels that act like subwindows but live in their own windows attached to a host graph window. The host graph and its exterior subwindows move together and, in general, act as single window.
You can now create panels that float above all other windows.
Statistics Improvements
Massive new Statistics support. See Statistics for details. Includes 32 new statistical test operations, 38 new cumulative distribution functions, 30 new probability distribution functions, 34 new inverse cumulative distribution functions, 10 random noise distributions and 17 general statistical utility functions.
Analysis Improvements
The Analysis menu was reorganized and Filter and Resample items were added along with a new Statistics submenu.
Histogram now supports two new modes for automatic determination of the number of bins.
Added the Loess operation, which smooths using locally-weighted regression smoothing. Loess can be used to interpolate over and replace NaNs.
Added the FilterFIR operation which can filter along any wave dimension, and can also generate simple digital filters, including a very steep notch filter.
Added the FilterIIR operation, which can filter along any wave dimension and generate simple IIR filters.
Added median smoothing to the Smooth operation. The median and boxcar smoothing modes now detect NaNs in the input data.
Matrix Improvements
Added new functions to MatrixOP and, for 3D operations, you can run the operation in multiple threads.
New operation: MatrixLinearSolveTD for linear solutions to tridiagonal matrices.
Curve Fitting Improvements
Added Quick Fit menu item to the Analysis menu and the Graph trace contextual menu. This provides quick access to simple fits using the built-in fitting functions.
Curve Fitting now offers Orthogonal Distance Regression in addition to ordinary least squares. This is useful for situations in which there are measurement errors in the independent variables as well as in the dependent variable.
Curve Fitting now supports fitting to implicit functions.
You can now specify a list of fitting functions to FuncFit. The result will be a fit to the sum of the functions.
All-at-once fit functions can now implement multivariate fit functions.
A new user-defined fit function format has been added that takes a single structure parameter. This allows you to transmit arbitrary data to a user-defined fit function.
You can write user-defined functions that run simultaneous curve fits in different threads to improve speed on multi-processor machines.
Fitting to a user-defined function can automatically use multiple processors.
Color Table Improvements
Added 14 new color tables: RainbowCycle, Rainbow4Cycles, GreenMagenta16, EOSOrangeBlue11, EOSSpectral11, dBZ14, dBZ21, Web216, BlueGreenOrange, BrownViolet, ColdWarm, Mocha, VioletOrangeYellow, and SeaLandAndFire.
Image Processing Improvements
New operation for processing stacks of multi-focal images.
ImageAnalyzeParticles can now provide minimum, maximum and average intensity level for each particle.
New thinning algorithm in MatrixFilter.
ImageSeedFill has three new keywords for specifying the seed pixel/voxel.
ImageTransform has new keywords: rgb2cmap,fuzzyClassify,roiTo1D and pad3d.
3D Analysis Improvements
ImageStats now supports operations on 3D ROI specification.
Data Import And Export Improvements
Substantially revised the SndLoadSaveWave XOP and ported it to Windows.
You can now specify comma as the decimal symbol when saving waves in text files.
Programming Improvements
Windows (and subwindows) may now be hidden.
The HideIgorMenus and ShowIgorMenus operations hide or show most of the built-in main menus. The trace popup contextual menu can be extended by User-Defined Menus.
User-Defined Menus can now specify Multiple Menu Items on one line, and Specialized Menu Item Definitions provide user-defined color, line style, marker, pattern, character and font menus.
New Independent Modules feature: You can now designate groups of one or more procedure files to be compiled and linked separately. Once compiled and linked, the code remains in place and is useable even though other procedures fail to compile. This allows control panels and menus to continue to function regardless of user programming errors.
You can now create multiple background tasks.
The internal method Igor uses to deallocate memory when waves are killed has been improved.
To provide support for computers with multiple processors and to allow creation of preemptive multitasking background tasks, a new class of user functions called ThreadSafe has been created.
Conditional compile using #if style compiler directives.
Miscellaneous Improvements
Added "regular expression" commands (i.e., Grep).
Print now supports wave subrange printing.
Why choose IGOR Pro?
- Journal-quality scientific graphs
- 3D and volume visualization
- Flexible image display
- Handles large data sets very quickly
- Extensive scientific and engineering data analysis
- Curve fitting, peak fitting
- Signal processing
- Image processing and image analysis
- Special support for evenly spaced data
- Completely programmable and customizable
- Macintosh and Windows Platforms