
Load one of the predefined template files and the information is displayed in the borehole view using placeholder logs. All the schemes and data tables from the original file are stored in the template file. Just enter your data into the data tables, activate the borehole view, and the logs will update with the new data.
Schemes
Schemes provide a way to load drawing properties based on a keyword or range value defined in the imported data. For example, a lithology log uses lithology schemes. The lithology scheme contains keywords, such as granite, clay, etc. Each of these keywords is assigned a fill pattern, contact line properties, line properties, and text properties.
Schemes can be reused; therefore, you do not have to go through the time-consuming process of assigning the same properties each time you create a new log. Reusing scheme files is ideal for those who want to continue making the same looking borehole designs for a wide variety of borehole data. Use one of the predefined scheme files included with Strater, or create your own.
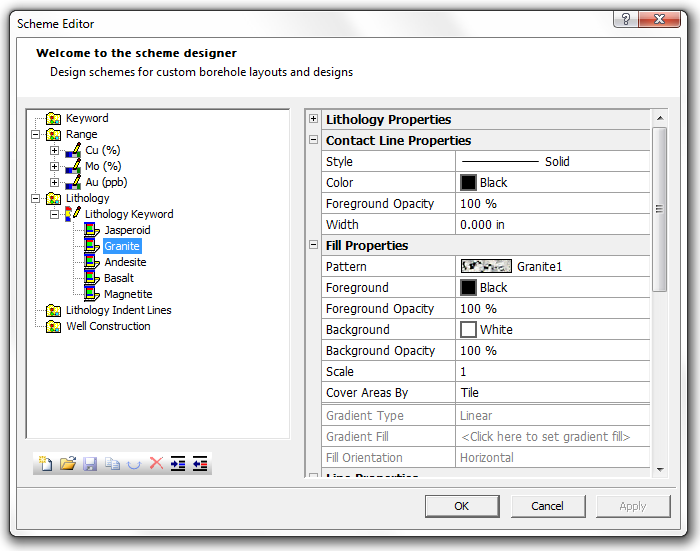
The Scheme Editor is where you link specific range values or keywords to display properties. In the example above, the lithology keyword "Granite" is tied to a granite fill pattern and other specific display properties. When the scheme is assigned to a lithology log, every time the word "Granite" is used in the database table field, Strater uses the properties assigned in the scheme in the graphical borehole display.
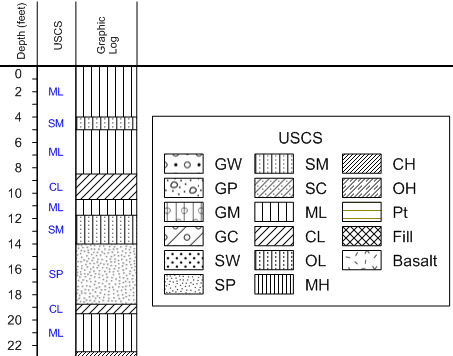
Use the USCS scheme file provided with Strater to define the fill patterns for your logs.
Property Manager
The user-friendly Property Manager allows you to interactively edit any object's properties. Select any object and the Property Manager updates with the specific properties for that object. Once you make a change, you can see the affects of that change immediately in the borehole view – without having to click any OK or Apply buttons.
Display the Property Manager sections as an array of tabs as shown below, or in the classic array of horizontal bars.
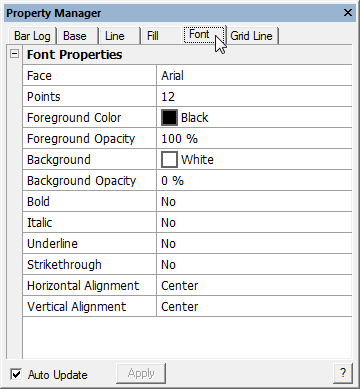
Tabs in the Property Manager help you quickly find and edit all the properties of a selected object
Object Manager
The Object Manager makes viewing and editing any object simple. It displays all the objects, organized by their design areas, in an easy-to-use hierarchical tree arrangement. Select objects in the Object Manager to easily edit them in the Property Manager, or check and uncheck the check box to show or hide them.
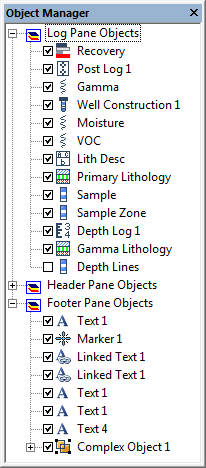 . .
Use the Object Manager to easily access and edit all the objects that are shown in your borehole view. |
Borehole Manager
Use the Borehole Manager to manage the different borehole views contained in the project. Multiple borehole views are useful for displaying multiple graphics for multiple wells or displaying different layouts for the same data. You can add and delete individual borehole views, choose to open and close borehole views, and load and save template files quickly with the Borehole Manager.
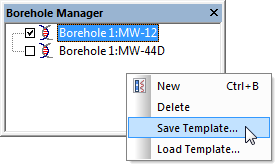
Organize all your borehole views in the Borehole Manager. With a simple right-click, you can add and delete borehole views, save a borehole view as a template, and load template files into new borehole views.
Additional Features
Strater is packed full of additional features designed to make your job faster and easier.
Tabs appear at the top of the screen when more than one window is open for you to easily access your data.
Specify any value in the data to be a NULL value.
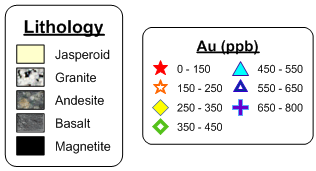
Save time by automatically creating legends for your schemes.
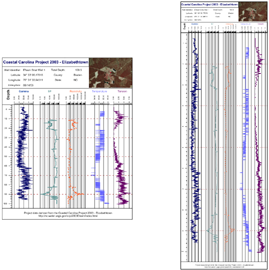
Display your logs on the screen in page view (left) or full view (right)!
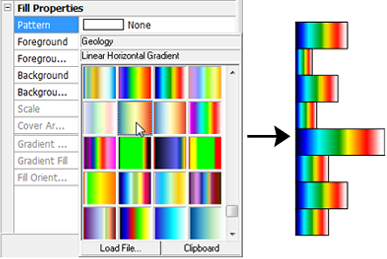
Customize you logs with gradient fill patterns.
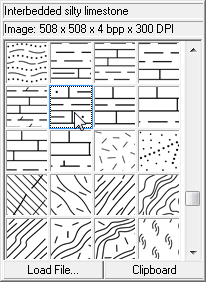
Fill using the included USGS fill patterns.
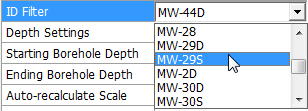
Change borehole names easily with a click of the mouse.
Use opacity options to make fill, line, symbol, and text properties of your log fully or partially transparent.

Zoom to the width of an object for a closer look.
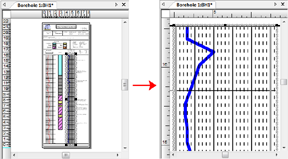
Zoom in the width of the pane to view your data when your log is very long.

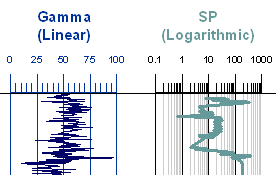
Set the scaling type to be linear or logarithmic.
Control the log direction by switching between Left/Right and Low/High.
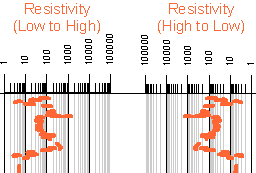
Add scale bars for variable logs in the header or footer areas.
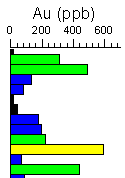
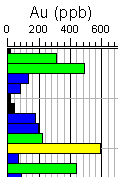
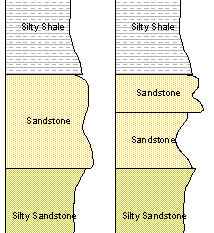
Overlay logs to create lithological profiles!
- Automatically or manually set the borehole starting, ending, and scaling depths.
- Automatically set the borehole depths based on a collars data table.
- Customize your Strater work area with your preferred buttons, commands, keyboard shortcuts, menus, options, and tool bars.
- Comprehensive Undo/Redo support.
- Setup Strater the way you like by controlling and modifying the default settings.
- Copy your logs in Strater and paste them directly into a Microsoft Word report or PowerPoint presentation.
- Scale your logs with the improved scaling options: relative, user-defined, and from a collars table.
- Use an unlimited number of items in a scheme.
- Convert a keyword scheme to a lithology scheme and vice versa.
- Format numeric labels by setting the number of decimal digits or adding a suffix or prefix.
- Add objects to the log pane by drawing, importing, or copying and pasting.
- Repeat tick labels that straddle page breaks on all pages for depth logs.
Printing
Print your borehole design to any Windows compatible printer or plotter. Choose between single-page and continuous printing. If your log design exceeds the page size you are printing to, you can choose to truncate the design to the page size, fit the design to the page, or print the design tiled on multiple pages.
If you have data for multiple wells, you can batch print your logs by selecting the design you wish to print, selecting all the wells you wish print using that design, and Strater will print all the logs for you!
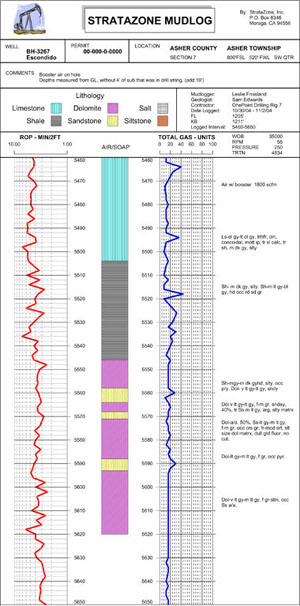
Print your borehole design, such as this mudlog, continuously to a plotter.
Supported File Formats
Strater supports many data and import/export formats.
Borehole View Import Formats
AN1, AN2, BLN, BMP, BNA, BW, DCM, DDF, DIC, DLG, DXF, E00, ECW, EMF, GIF, GSB, GSI, JPG, LGO, LGS, MIF, PBM, PCX, PGM, PLT, PLY, PNG, PNM, PPM, RAS, RGB, RGBA, SHP, SID, SUN, TGA, TIF, VTK, WMF, X, XIMG
Borehole View Export Formats
BLN, BMP, BNA, BW, CGM, DXF, EMF, EPS, GIF, GSB, GSI, JPG, MIF, PBM, PCX, PDF (vector/raster), PGM, PNG, PNM, PPM, RAS, RGB, RGBA, SHP, SUN, TGA, TIF, WMF, X, XIMG
Data Table Export Formats
BLN, BNA, CSV, DAT, SLK, TXT, or XLS
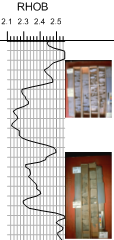
Load data from multiple sources into your borehole design, such as data from an LAS file and images in JPG format.