Create Watershed Maps
Watershed maps automatically calculate and display drainage basins and streams from your grid file. Create colorful watershed maps to display regions draining into a stream, stream system or body of water. Display the catchment basins, streams, or both!
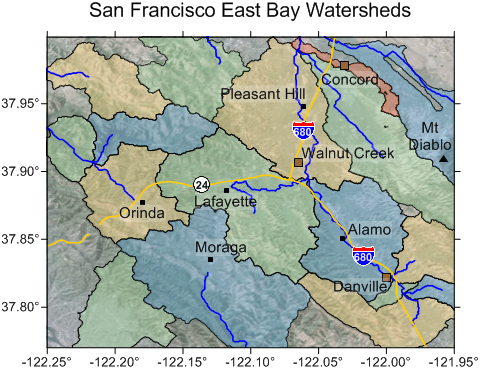
Display watershed catchment basins and streams to determine which areas are draining into which streams.
Include Feature Attributes
Keeping your data organized and labeled has never been easier. Surfer 11 supports attributes for all objects.
For example, import your SHP file and the attributes from the DBF are imported for all features within the SHP!
Label the features with the attributes, edit the attribute data, or export the features with the attributes to a new file.
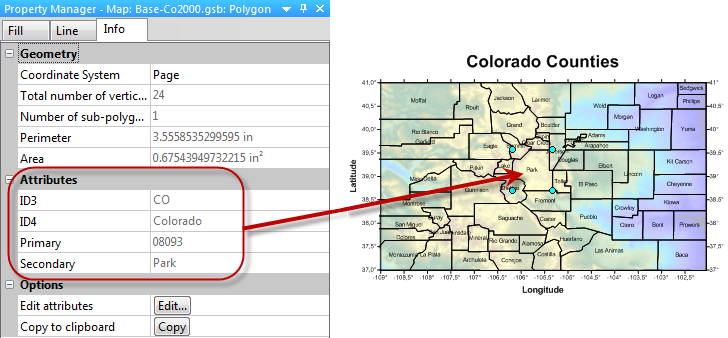
Attributes are imported with your base map files! Label the base map objects with any attribute.
Use the Text Editor
Save time formatting your text with the easy-to-use Text Editor! Formatting a few specific characters in a text string, subscripting and superscripting, and inserting equations has never been easier.
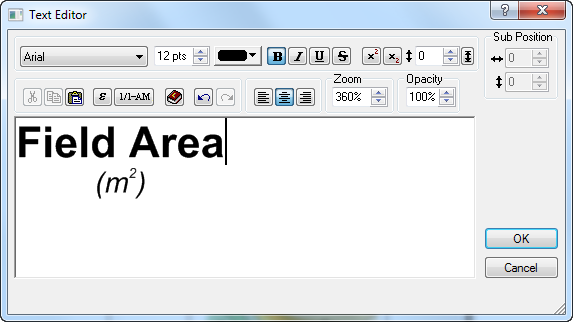
Use the Text Editor to quickly and easily create and edit custom text.
Create Automatic Profiles
Surfer's automatic profile tool makes it easy to visualize the change in Z value from one point to another. Reshape the profile line on the map and the profile immediately updates!

Easily create a profile by simply drawing a line on the map!
Perform Advanced Boundary Editing
Create boundaries just the way you need them! Surfer's new boundary editing tools make it easy to edit your boundaries so that you have what you need to display your data most effectively. Convert between polylines and polygons. Connect polylines together to simplify your objects, or break polylines to trim them. Combine polygons into a complex polygon so that they are grouped together and have the same fill (especially useful if trying to blank outside multiple polygons), or split a complex polygon into separate polygons for editing individual areas.
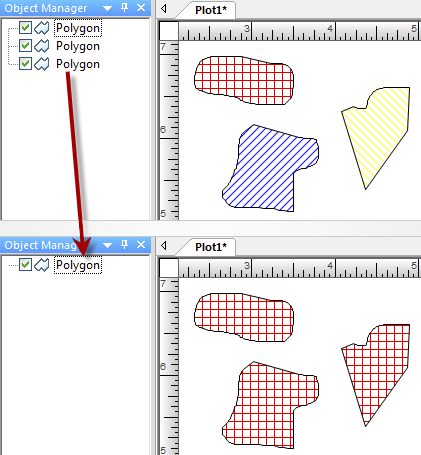
Select multiple individual polygons and combine them into a single complex polygon!
Measure Distances and Areas
With the new measure tool, you simply start drawing and the length and area are automatically calculated and displayed! Copy the information from the Measure box to paste into Excel or include as text in your Surfer project.
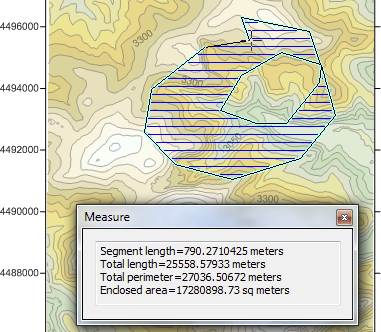
Use the Measure tool to draw a region over the map and
measure the length and area of the region!
Grid Only Inside Your Data Limits
Automatically blank the data outside the perimeter of your data points during gridding. Simply check the Blank grid outside convex hull of data check box in the Grid Data dialog box, and Surfer does the rest for you!
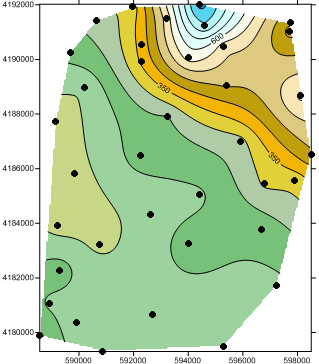
The area outside the data limits in the grid file is automatically
blanked with no extra effort on your part!
Use the Grid Node Editor Enhancements
The Grid Node Editor is more powerful than ever! Zoom in and out using the tools on the toolbar, and display Z values on the grid nodes when zoomed in. Enable cursor tracking, click on a node in the grid node editor window and see the same location highlighted on the map in the plot window!
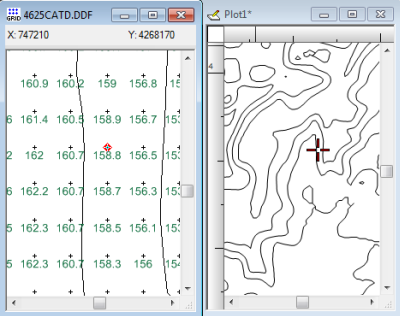
Know exactly where you are editing grid node values by
tracking the cursor location simultaneously over a map in the plot window.
Increased Resolution for Your Surface Map
Surfer now takes advantage of the power of current video cards! The surface map resolution has been increased from a mere 1024 to a whopping 4096 pixels. See the clarity in your detailed surface maps, or with high resolution imagery draped on the surface.
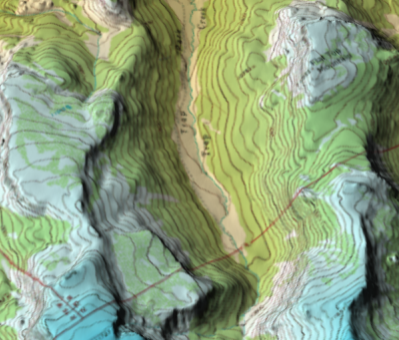
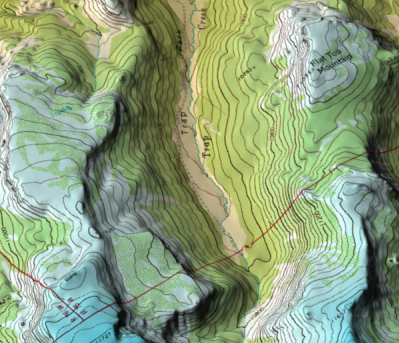
You can see the difference! Compare the image on the top,
displayed in Surfer 10 with a maximum of 1024 pixels,
with the clear,
crisp resolution of the image on the bottom,
displayed in Surfer 11
at 4096 pixel resolution.
Keep Your Map Layers Organized
Surfer helps keep you organized by appending the source data file name to the layer name! If you have multiple layers of the same map type, this helps tremendously in knowing which layer is which in your map. Finding layers to edit is much easier when they are uniquely named, and you don't have to spend your valuable time renaming the layers yourself.
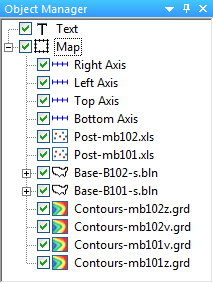
Surfer appends the source data file name to the layer name
to help you keep track of your layers.
More Classes for Your Classed Post Map
Include all your categories in a classed post map! The number of allowed classes is increased from 30 to 200.
International Font Support
Surfer 11 supports international fonts and characters. Use any language, such as Chinese, Russian, Greek, Hebrew, or Arabic. All aspects of your map support international characters. For example, you can set your drawn text, axes labels, axis titles, and more to any language. Customize your map with language that your audience will understand.
Reference Your Map
Don't worry about forgetting to set the coordinate system for a layer when you create a map or add a layer from an unreferenced file. Enable the new option to prompt for a coordinate system whenever creating or adding a layer from an unreferenced file!
Set Symbol Line Color
Your waiting is over! Now fill and line colors can be selected individually for all symbols!
Lock Your Objects
Once you get your Surfer project just the way you want it on the page, lock the position of the objects so you don't accidentally move them!
Convert Text Data to Numbers
Ever wonder why Surfer doesn't read your data, only to discover that the data is formatted as text instead of numbers? Now convert numbers from text format to numeric format directly in the Surfer worksheet!
Increased File Compatibility!
Newly supported import formats:
- Open data in LiDAR LAS format.
- Open grids in E00 and GRIB formats.
- Open grids in zipped SDTS files directly, TAR and TAR.GZ formats.
- Import GPX files as base maps.
- Save data in XLSX format.
- Save grids in CPS-3 or ZMAP formats.
- Export to a GeoPDF.
- Exporting to a PDF now supports partial transparency and page sizes.
- Turning off the axes won't create extra white space around the map after exporting to image file! You don't have to turn off tick marks/labels before export to image anymore.
New Coordinate Systems, Projections and Datums
New Coordinate Systems:
- State Plane 1983 - Kentucky Single Zone
- New Zealand Map Grid
- New Zealand Transverse Mercator 2000 (NZTM 2000)
- Irish National Grid
- Italy Mainland Zone 1 Gauss-Boaga
- Italy Mainland Zone 2 Gauss-Boaga
- Sardinia – Gauss-Boaga
- Sicily – Gauss-Boaga
- Switzerland - CH1903 LV03
- Switzerland – CH1903+LV95
- JGD2000 / Japan Plane Rectangular
- JGD2000 / UTM
New Projections:
- New Zealand Map Grid
- Updated Hotine Oblique Mercator
- Updated Hotine Oblique Mercator 2-Point
New Datums:
- Rome 1940 - Italian Peninsula (Greenwich Meridian)
- Rome 1940 - Sardinia (Greenwich Meridian)
- Rome 1940 - Sicily (Greenwich Meridian)
- New Zealand Geodetic Datum 1949 (Bursa-Wolf)
- New Zealand Geodetic Datum 2000 (NZGD2000)
- CH1903 – Switzerland (Bursa-Wolf)
- CH1903+ - Switzerland
- ITRF90 (Bursa-Wolf)
- ITRF94 (WGS84 base)
- Japan Geodetic Datum JGD2000 (WGS84 base)
The complete Surfer package includes:
- Free Online Training Videos
- Surfer Quick Start Guide
- Free Technical Support
- Self-paced Training Guide
- Available Full User's Guide (Optional)
- Surfer CD, or downloaded installation file