WINKS SDA BASIC performs standard statistical calculations such as (for more features, see the Professional Edition):
- Descriptive statistics (means, standard deviations, median, coefficient of variation, skewness, kurtosis, highest and lowest values, etc.)
- Test for normality
- Confidence intervals, percentiles, Tukey 5-number summary
- Cp and Cpk analysis (QC)
- Statistics by group (up to 2 factors)
- Statistics from counts
- Percentile calculations
- Calculate permutations and combinations
- Calculate p-values for Normal, t, Chi-Square and F statistics
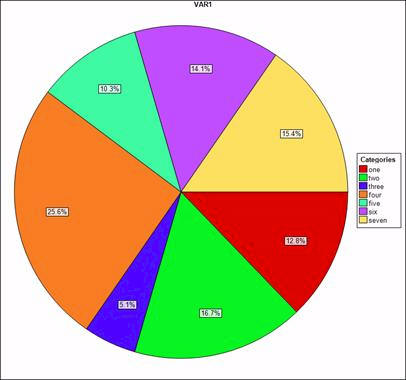
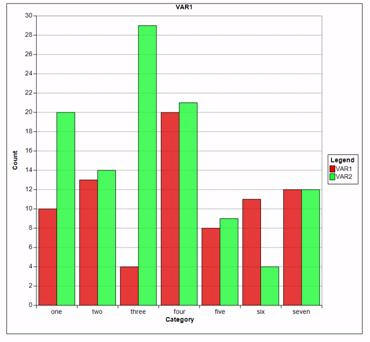
- Graph features: Histograms, bar charts, stacked bar charts, pie charts, line charts, time series plots, stem and leaf, scatterplot, fitted regression line, matrix of scatterplots, etc.
- Create Excel charts directly from WINKS
- Pie and Bar charts from keyboard data
- t-tests -- single sample, independent group and paired t-test
- t-test from summary data
- One-Way Analysis of variance with multiple comparisons (Newman-Keuls, Scheffe, Tukey) from raw or summarized data
- Repeated Measures ANOVA with post hoc multiple comparisons
- Dunnett's test (from raw or summarized data)
- Frequency tables
- Goodness of fit analysis
- Crosstabulation (rxc) Chi-Square analysis -- with multiple comparisons of proportions for 2xc and rx2 tables
- Fisher's Exact test
- Correlation (Pearson and Spearman)
- Comparison of proportions
- Point biserial correlation
- Simple linear regression
- Multiple linear regression.
- Mann-Whitney nonparametric test for two independent group comparison
- Kruskal-Wallis nonparametric test for three or more independent group comparison, with post hoc nonparametric multiple comparisons (Dunn's Test)
- Wilcoxon signed rank test and the Sign test for paired group comparison
- Friedman's test for repeated measures with post hoc nonparametric multiple comparisons
- Cochran's Q test for comparison of dichotomous data
- McNemar's test for paired dichotomous data
- Survival analysis & Life Tables (Actuarial and Kaplan Meier -- comparison by group using Mantel-Haenszel for post hoc comparison of groups)
- Simulations -- Central limit theorem, confidence intervals, coin flip
- Report generator
Designed for researchers who need to get statistical answers quickly. Plenty of examples are available to get you started. Hundreds of hours of working with consultants and researchers went in to creating the interface as well as creating understandable examples and program output.
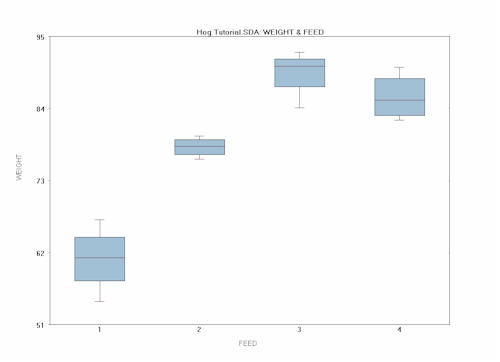
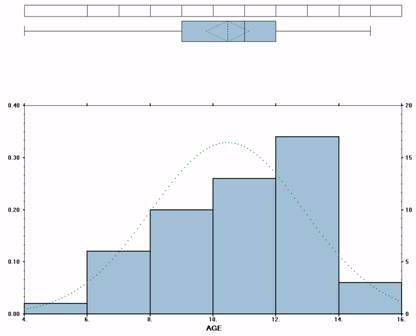
Sample Output and Graphs:
WINKS is an economical, reliable and simple to use statistical analysis tool for researchers
It contains a wide range of statistical tests including many handy features not found in programs such as SPSS or SAS -- for example, easy analysis from summary data (as well as from raw data), nonparametric multiple comparisons, APA standard analysis write-up suggestions and more.
Friendly interface with easy Excel-like data handling & graphs (reads and writes Excel files.)
Data entry and manipulation:
- Spreadsheet data entry
- Cut, copy, paste data
- Easily opens data from Excel Files (as well as from CSV and DBF files)
- Recode data
- Calculate new variables
- Filter variables for analysis
- Select a random sample
- Sort data
- Delete and insert rows and columns of data
WINKS Analysis Limitations
General limitations
- Maximum number of fields per database - 250
- Maximum length of a character field - 65
- Maximum width for a numeric variable - 15
- Maximum number of records per database - 32,000
- Note: Databases may be created above the 32,000 record limit, but this is the maximum record count verified to work with WINKS.
- Detailed statistics - 32000 records
- Summary statistics - 32,000 records, 1000 groups, 100 fields
- Stem and leaf diagram - 500 records
- Normality test - 1,000 records
- Bar/line/area charts - 100 bars
- Pie chart - 50 slices
- By-group chart - 10 groups
- Time series plot - 10 groups, 6000 points
- X-Y plot - 1000 records
- Histogram - 32000 records
- FI Scatterplot - 1000 points
- Analysis Scatterplot - 5000 points
- T-test (Ind Gp) -- 32,000 records
- One-way ANOVA - 40 groups, up to 32,000 records
- Over 4000 records, the box plots will not be available for t-test and ANOVA
- One-way repeated measures - 40 groups, 4000 points
- Kruskal-Wallis comparisons - 20 groups
- Friedman's test - 20 groups
- Cochran's Q test - 20 groups
- Simple linear regression - 3200 cases
- Multiple regression - (independent groups * cases) < 3200
- Correlation - 15,000 records
- Crosstabulations - 32,000 records, table limit 15x120
- Frequencies - 32,000 records, table limit 128 categories
- Goodness of fit - 12 groups
- Comma delimited import - maximum of 128 fields, 65 max width or char field.