- Introduzione
- Novità
- Caratteristiche
- Gallery
- Requisiti di sistema
Surfer is a full-function 3D visualization, contouring and surface modeling package that runs under Microsoft Windows. Surfer is used extensively for terrain modeling, bathymetric modeling, landscape visualization, surface analysis, contour mapping, 3D surface mapping, gridding, volumetrics, and much more.
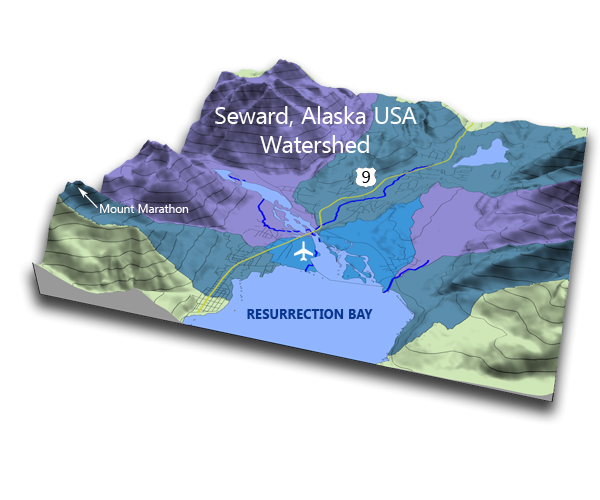
Surfer's sophisticated interpolation engine transforms your XYZ data into publication-quality maps. Surfer provides more gridding methods and more control over gridding parameters, including customized variograms, than any other software package on the market. You can also use grid files obtained from other sources, such as USGS DEM files or ESRI grid files. Display your grid as outstanding contour, 3D surface, 3D wireframe, watershed, vector, image, shaded relief, and post maps. Add base maps and combine map types to create the most informative display possible. Virtually all aspects of your maps can be customized to produce exactly the presentation you want. Generating publication quality maps has never been quicker or easier.
Surfer's sophisticated interpolation engine transforms your XYZ data into publication-quality maps. Surfer provides more gridding methods and more control over gridding parameters, including customized variograms, than any other software package on the market. You can also use grid files obtained from other sources, such as USGS DEM files or ESRI grid files. Display your grid as outstanding contour, 3D surface, 3D wireframe, watershed, vector, image, shaded relief, and post maps. Add base maps and combine map types to create the most informative display possible. Virtually all aspects of your maps can be customized to produce exactly the presentation you want. Generating publication quality maps has never been quicker or easier.
|
Novità What's New in Surfer 11? |
Surfer 11 Features
Contour Maps
Surfer contour maps give you full control over all map parameters. You can accept the Surfer intelligent defaults to automatically create a contour map, or double-click a map to easily customize map features.
Display contour maps over any contour range and contour interval, or specify only the contour levels you want to display on the map. And with Surfer you can add color fill between contours to produce dazzling displays of your maps, or produce gray scale fills for dramatic black and white printouts.
I work with a lot of LIDAR data and Surfer has been outstanding for generating contours quickly and accurately.
--Michael Mayerle, President of JMS Geomatics
Read more...
Requisiti
|


